The Sound Wave

Now that we’ve looked at our different instruments and classified them based off of how the generate a sound, let’s talk a little bit more about what sound actually is.
Simply put, sound is just a series of waves that travel through the air from a source that is vibrating. This is why when we looked at the characteristics of our different instruments, we focused on the different ways that vibrations were created.
As sound waves move through the air, the process is known as propagation. Furthermore, the reason they're able to move outward is because each wave is made up of alternating levels of air pressure, which propel them forward. Imagine yourself out on the water, and think about how the waves move around you. Ocean waves rise and fall continuously as they move, and sound waves work in much the same way.

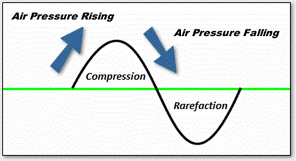
If we look at the image to the right, we can see how these vibrating sound waves can be visually represented as a Sine Wave. We can also see the alternating periods of air pressure, both high, when the wave is is rising, and low, when the wave is falling.
These air pressure periods also have specific names. We use the term compression to describe the areas of high pressure, and rarefaction for the areas of low pressure.
These air pressure periods also have specific names. We use the term compression to describe the areas of high pressure, and rarefaction for the areas of low pressure.
Another advantage to representing a sound wave in graph-form as sine waves, it also allows us to describe and visualize other key aspects of a sound, such as its frequency, and amplitude.

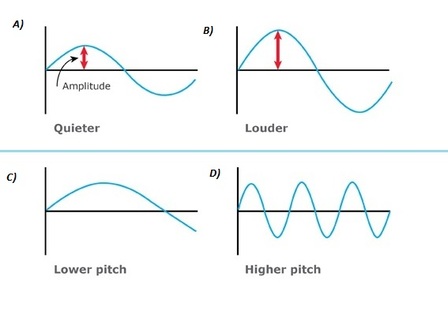
In the photo to the left, we see 4 different graphic representations of sound waves. In all 4 of these graphs, we can relate amplitude to our vertical axis (up and down), and frequency to our horizontal axis (left to right).
We use the term amplitude when we're trying to describe how loud or soft a sound is. In wave form, this means that the "taller" a wave is, the louder it will sound.
We measure amplitude from our "zero point" (horizontal line) to the "peak" of the wave (the highest point). Using graphs A and B we can demonstrate this relationship: Since the sound wave in A has a lower amplitude than B (not as high) it means that volume wise it also won't be as loud. Most often, we measure amplitude in decibels(dB).
We use the term Frequency, to describe the pitch of a sound wave (how high or low it sounds). Every single sound that we hear has a unique frequency number that can be measured and graphed. But in order to find this we have to look at how fast the sound wave is moving; the faster the wave is moving, the higher a note will sound. We determine this wave speed by refering back to compression and rarefaction. Each time both phases are completed it is called a wave cycle. Frequency measures the amount of cycles that are completed in 1 second.
So what this means is that the more cycles that are completed per second, the faster the wave is moving, which results in a higher pitch. Looking back above at graphs C and D, we can see this principle in action. In C, the wave cycle takes much longer to complete than in D, which means that the wave is moving much slower, and will sound lower too.
Frequency is measured in Hertz (Hz) which counts the number of cycles completed in a second. For example a note with a frequency of 440Hz, completes 440 cycles in 1 second.